VSL Optimization Software: What to Actually Look For
Search "VSL optimization software" and read what ranks. I did, this week. The results are script generators, slide builders, AI voiceover tools, and one vendor's feature page - almost all of it software for making a VSL, none of it about what the word optimization means. Which is a strange thing to find, because the person typing that query almost never needs another script tool. They have a VSL. It's live. It has traffic. And somewhere between the first frame and the buy button, money is leaking out of it faster than they can explain.
Optimization starts where creation ends: with a video that exists, an audience that watches it, and a number that isn't what it should be. The software for that job looks nothing like a script generator, and since nobody ranking for the term seems interested in defining the category, let's do it properly - capabilities first, then how to judge whether a given tool's version of each capability is real.
VSL optimization software is the instrument layer for a live video sales letter: per-second retention analytics and heatmaps, watch-depth attribution that ties viewing to revenue, split testing with honest statistics, and conversion tracking that survives ad blockers and browser privacy rules. Evaluate any option on four pillars - data fidelity, statistical honesty, revenue linkage, and privacy posture - and ignore feature counts.
What is VSL optimization software?
Software that measures a live VSL and turns the measurements into edit decisions. It answers four questions creation tools can't: where do viewers leave, what did buyers watch that non-buyers didn't, which version wins, and is the ad platform seeing the conversions? If a tool can't answer those, it belongs in the creation category, whatever its landing page says.
The distinction matters because the two categories fail differently. A bad creation tool wastes a day. A bad optimization tool quietly misreports for months - you re-edit the wrong section, kill the winning variant, or scale a campaign whose real returns you can't see. Creation tools are judged on output quality you can watch. Optimization tools are judged on data quality you have to trust. That's why the evaluation below is mostly about trust.
Optimization software is judged by data fidelity, not feature count. A wrong retention curve is worse than no retention curve.
Which capabilities actually move conversions?
Four, and they compound in order: retention analytics show where attention dies, watch-depth attribution shows which seconds produce buyers, split testing proves which fix worked, and script-level diagnosis turns the curves into edit decisions. Tracking reliability underneath all four decides whether any of it reflects reality.
Retention curves and heatmaps. The foundational instrument. YouTube's own analytics documentation treats the first 30 seconds as its headline retention moment - the "intro" survival number - and flags spikes (rewatched moments) and dips (skips and exits) as the units of analysis. That's the right grammar for reading any VSL curve. The optimization-grade version adds watch density: not just who was present at each second, but which sections got rewatched, which got skipped past, and where the seek behavior says "confusing" versus "boring." The full method for reading these is in our video engagement heatmaps guide.
Watch-depth attribution. The capability that separates this category from platform analytics. A retention curve weighted by viewers tells you where the audience left. The same curve weighted by revenue tells you where the buyers came from - which watch depth your purchasers actually reached before converting. Those two curves disagree more often than you'd expect, and when they do, the revenue curve is the one that should direct your edits. The metrics stack for this is covered in the four numbers that matter on a VSL launch.
Split testing. Not a checkbox - a statistics implementation, and the section below is entirely about how to judge one.
Script analysis from the data. The newest layer of the category: mapping retention behavior back to the script timeline, so "minute 14 cliff" becomes "the cliff starts two sentences into the price reveal." Whether a tool does this with AI or with a well-designed timeline view matters less than whether the mapping exists at all - the alternative is scrubbing through your own video with a spreadsheet open.
How do you judge the quality of the analytics?
Three tests: granularity (per-second, not quartiles), honesty about the muted-start reality, and revenue linkage. If the tool's finest resolution is 25% quartiles on a 30-minute VSL, each data point summarizes seven and a half minutes - roughly the resolution of asking viewers to fill in a survey afterward.
The muted-start point deserves numbers, because it changes what "good analytics" means. The most credible published data on sound-off viewing is old but consistent: a 2019 Verizon Media and Publicis survey of 5,616 US consumers found 69% watch video with sound off in public places, and 80% said captions make them more likely to watch a video to the end. Facebook's internal testing back in 2016 measured 12% longer average view time on captioned video ads. The stats have aged; the browser policies that force muted autoplay have only hardened since. So an analytics layer that can't tell you whether the viewer ever unmuted is missing the single most consequential event in the first ten seconds of every modern VSL view.
On benchmarks: Wistia's State of Video dataset - built from over 13 million videos - shows engagement declining as videos get longer, with an additional roughly 11% engagement drop once videos cross the 30-minute mark. Useful context, but note what it is: engagement benchmarks across all business video, not VSL conversion data. The trap with benchmark-driven optimization is optimizing toward the average of videos that aren't trying to sell anything. Your own revenue curve beats the industry's engagement curve every time they disagree.
Benchmarks tell you what the average video does. Your revenue curve tells you what your money does. Optimize toward the second one.
What should split testing include before you trust it?
Either predeclared sample sizes with a fixed decision point, or statistics designed for continuous monitoring - and the tool should tell you which it uses. Evan Miller's canonical analysis showed that peeking at results after every observation and stopping at the first significant reading inflates a nominal 5% false positive rate to 26.1%.
This is the least glamorous section and the one that saves the most money. The failure mode is universal: launch an A/B test, watch the dashboard daily, and declare victory the first morning the significance badge turns green. Do that habitually and more than a quarter of your "winners" are noise - you'll implement them, see no lift, and conclude testing doesn't work. Testing works. Peeking doesn't.
What to look for in a tool's testing implementation:
- A sample size answer. The tool should ask for (or compute) the sample needed for the effect size you care about before the test starts, not after.
- Peek-resistant design. Sequential testing methods or Bayesian approaches built for continuous monitoring - named, in the docs, not implied by a confidence meter.
- Sticky variant assignment. The same returning viewer must see the same variant, or your test is measuring your randomizer.
- Revenue as a goal metric. A variant that lifts opt-ins and flattens revenue is a loser wearing a winner's badge. The test should settle on the metric you bank.
A tool that shows a live significance number with no guardrails isn't giving you statistics. It's giving you a slot machine with a p-value on the reels.
What about tracking reliability and privacy?
Every capability above consumes event data, so the tracking layer decides whether any of it is true. Roughly 29.5% of internet users run ad blockers per DataReportal's Q2 2025 data, and Safari caps client-side cookies at seven days - which is why serious optimization stacks pair browser measurement with server-side event delivery.
Two evaluation points here. First, data completeness: if the analytics script is blocked for a third of viewers, your retention curves describe the unblocked two-thirds - fine for shape, dangerous for revenue math. Ask any vendor how their measurement behaves under ad blocking and what share of events arrives server-side. The buyer's questions for that conversation are in our server-side tracking checklist.
Second, privacy posture. For EU traffic, the regulatory direction is clear: viewer-level behavioral tracking sits in consent territory - European regulators' ePrivacy guidance explicitly covers pixels and unique identifiers, not just cookies - while aggregated measurement has a defensible consent-free path. In practice, the platforms themselves already model this: mainstream analytics products enforce minimum-audience thresholds before showing granular reports. Evaluate a tool on the same axis: what does it show when consent is refused, and does its reporting degrade gracefully to aggregates instead of silently thinning out? A vendor with no answer is handing the legal question to you.
How should you actually evaluate the options?
Score each candidate on the four pillars - data fidelity, statistical honesty, revenue linkage, privacy posture - using your own live VSL during the trial, not the vendor's demo data. One week and one funnel is enough to see whether the retention curve matches reality and the numbers tie to your payment processor.
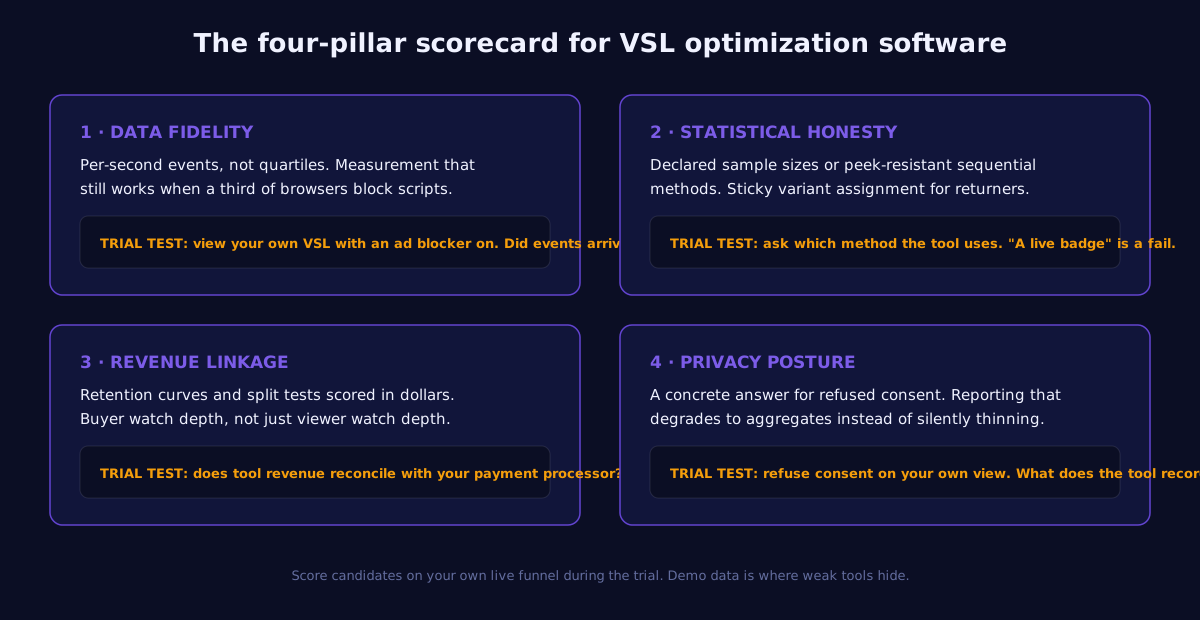
The trial protocol that fits in a week:
- Day 1: install on your live VSL page, real traffic. Confirm events flow with an ad blocker enabled on your own test view.
- Day 2-6: let it collect. Don't touch anything.
- Day 7: three reconciliation checks. Does total revenue in the tool match your payment processor within a few percent? Does the retention curve's biggest cliff match what you see scrubbing the video at that timestamp? Does the tool's view count roughly agree with your page analytics after accounting for blocked scripts?
Pass all three and the instrument is trustworthy enough to direct edits. Fail the revenue reconciliation and nothing else the tool says matters - you'd be optimizing a fiction with great charts.
Deliberately absent from this post: vendor names, ours included. Capability lists are where category education belongs; head-to-head claims belong where they can be specific, so the named matchups live in the comparison library and the operator-tested rankings in the best VSL platforms list.
Frequently asked questions
Run the four-pillar trial on a real funnel
Per-second retention, revenue-tied watch depth, and server-side tracking on your own VSL, this week. Try any plan for $1.
Start your $1 trial →