VSL A/B Testing: How to Run a Split Test That Actually Tells You Something Actionable
You've spent weeks crafting the perfect video sales letter, paid to drive traffic to it, and now you're ready to start testing. So you tweak the hook, swap out the offer, and shorten the ending all at once. A week later, one version has a higher conversion rate, so you declare a winner and move on. Sounds familiar?
Here's the problem: that test just told you absolutely nothing useful.
VSL A/B testing is one of the most misused tools in direct-response marketing, and most marketers don't realize their results are meaningless until they've already rolled out a worse-performing script. Wrong variable isolation, sample sizes that are far too small, and no statistical significance threshold combine to produce data that feels decisive but actively leads you in the wrong direction.
In this post, you'll learn exactly how to set up a video sales letter split test that actually holds up. We'll cover the one-variable rule, the sample sizes you genuinely need, why watch depth beats conversion rate as your primary signal, and the common mistakes that silently invalidate your results while the test is still running.
Why Most VSL Split Tests Are Set Up to Fail
Most VSL split tests produce conclusions that feel decisive but actively make your funnel worse. Three failure modes are responsible for almost every bad test outcome.
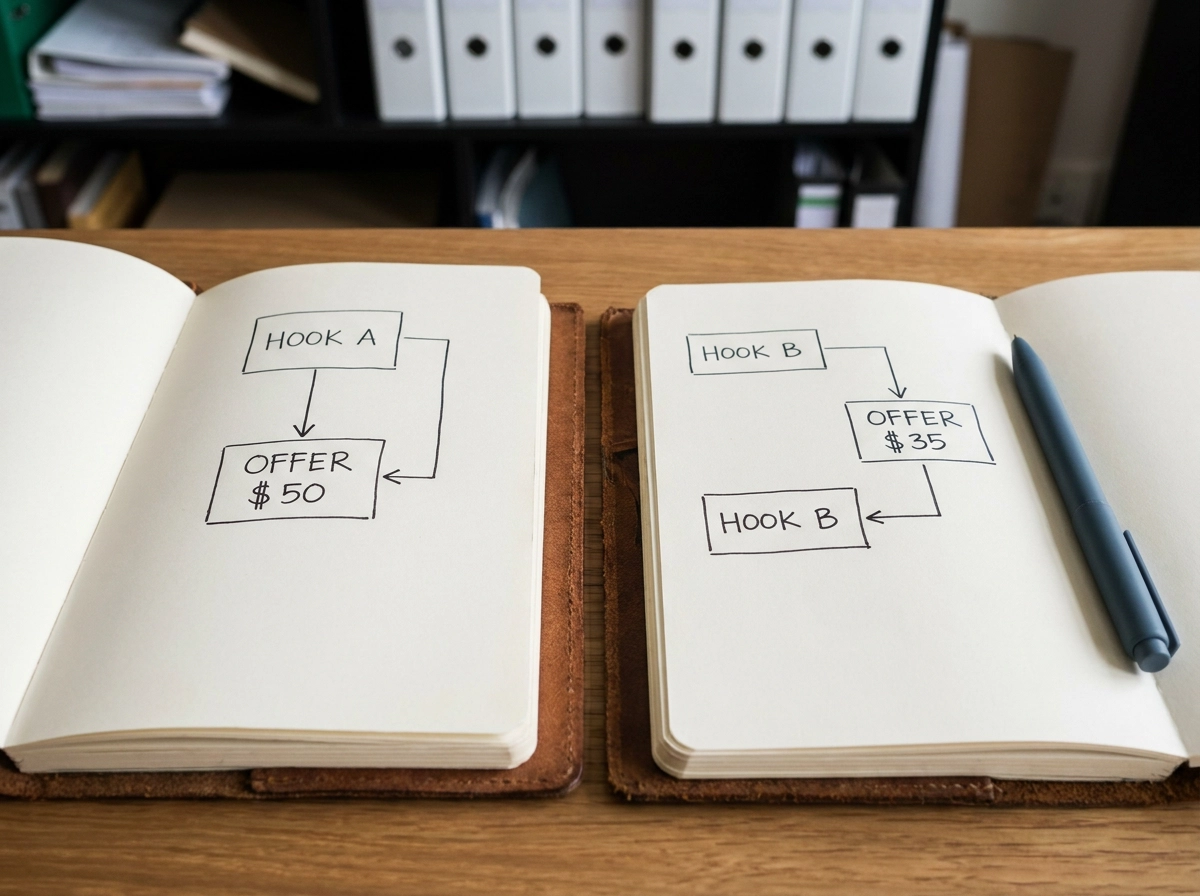
Wrong variable isolation. You change the hook and tweak the offer price at the same time, one variant wins, and you have no idea which change drove the result. The "winner" is uninterpretable data wearing a confidence costume.
Insufficient sample size. You need at least 100 conversions per variant before conversion rate means anything. Most VSL campaigns running paid traffic never hit that threshold before someone gets impatient and calls a winner.
Reading results too early. Early data fluctuates wildly. A variant that appears to lead on day two can flip to a loser by day ten. Stopping a test because results "look good" is just confirmation bias with a dashboard.
Conversion rate is a particularly noisy signal on video campaigns. Small sample sizes amplify random variance, so a loser can easily outperform a winner for days before the data stabilizes. High ad spend does not fix this. You can burn $5,000 in a weekend and still have 30 conversions per variant, which is statistically useless.
The compounding damage is what kills funnels slowly. Each bad test conclusion produces a script change that degrades performance. Your next test starts from a worse baseline. Common mistakes in VSL analytics tend to stack, not cancel out.
VSL testing is also harder than landing page testing because video adds a behavioral layer that conversion rate ignores entirely. Most VSLs fail to convert not because the offer is wrong, but because viewers drop off before they ever hear it, and a single conversion rate number will never show you that.
The One-Variable Rule: What You Can Actually Learn From a Single Test
The fix starts with one rule: change exactly one thing per test.
If you rewrite the hook and drop the price by $100 in the same variant, you cannot tell which change moved the needle. That's not a test result; it's a coin flip with extra steps. The most common version of this mistake is rewriting the hook while adjusting the offer frame, then declaring the winner a "better VSL script." It isn't. It's an uninterpretable result that gives you false confidence and a corrupted baseline.
Build your test sequence in this order:

Hook (affects 100% of viewers, highest leverage)
Offer frame (affects viewers who stayed through the build)
CTA (affects viewers already considering the buy)
Video length (test last; it touches everything above it)
Each element filters a smaller audience than the one before it. Testing the CTA before you've locked in a strong hook is optimizing the last 5% while ignoring the first 60%.
What actually counts as isolating a single variable in a VSL context: a hook test means the same voiceover pacing, same background music, same offer price, same CTA, same total video length within a narrow margin, avoid length differences large enough to change viewing behavior on their own. Only the opening 60 to 90 seconds changes. If you re-record the whole video with a different energy level, you've changed the variable and the confound simultaneously.
Properly isolated: Hook A opens with a bold claim; Hook B opens with a problem-first question. Everything else is frame-for-frame identical. Now your result tells you something specific about how your audience responds to framing style. Testing hooks without fooling yourself requires that level of surgical control.
Multivariate testing is technically valid in high-traffic environments, but most VSL funnels running paid traffic don't generate enough conversions per variant to reach significance on a single variable, let alone four combinations. Save multivariate for when you're clearing 500-plus conversions a week. Until then, it adds statistical complexity without adding useful signal.
Sample Size and Statistical Significance: The Numbers You Need Before You Call a Winner
Once you've locked in your variable, the next place most marketers blow it is calling a winner too early. The culprit is almost always a misreading of statistical significance.
Here's what 95% confidence actually means: if you ran the same test 100 times, you'd expect the result to fall within that range about 95 times. It does not mean you're 95% certain your winning variant is better. At the p<0.05 threshold, roughly 1 in 20 significant results will be a false positive by chance alone. That's a real tax on every test you call early.
A widely-cited practitioner baseline is 100 conversions per variant, not clicks, not views. That threshold is a rule of thumb, not a statistical guarantee, and it ignores baseline conversion rate and effect size; use a proper sample size calculator to confirm what your funnel actually needs before you launch.
It gets harder. Ad blockers and iOS privacy settings can hide up to 30% of conversion events from your browser pixel. If your dashboard shows 70 conversions per variant, you may have actually hit 100 in reality. That's why statistical significance is harder to reach than it looks on a standard analytics dashboard, and why server-side tracking matters before you start interpreting results.
Time is the other constraint. Most practitioners recommend a minimum of 7 days to capture day-of-week variance before reading results. Day-of-week behavior can swing conversion rates significantly on most direct-response offers. A test that runs Thursday through Sunday is measuring the weekend audience, not your full buyer pool.
Calculate your minimum duration before you launch:
(100 conversions per variant) / (daily conversions per variant) = minimum days
If you're driving 10 conversions per day per variant, you need at least 10 days, before accounting for pixel data loss.
Stopping a test because it hit your pre-set significance threshold is methodology. Stopping because the numbers "look good" after three days is bias. Set your threshold before you launch, then don't touch results until you hit it. A video analytics platform that surfaces significance thresholds directly removes the temptation to eyeball percentages and rationalize a premature call.
Use Watch Depth as Your Primary Signal, Not Conversion Rate
While you're wrestling with conversion significance thresholds, there's a faster, more reliable signal sitting right inside your video: watch depth.
Watch depth is the percentage of viewers who reach each second of your video. On small-sample VSL campaigns, it's far more stable than conversion rate because, for most VSL campaigns, you accumulate far more watch-depth data points than purchase events, making engagement signals readable sooner.
What a healthy watch-depth curve looks like
Every VSL shows three predictable drop zones: a sharp fall in the first 30 seconds where weak hooks lose the room, a dip near your offer reveal where the price anchor lands, and a final drop just before your CTA. Those aren't problems; they're normal friction. What you're watching for is a drop significantly steeper than your baseline in one variant versus the other.
For example, a sharp 15% drop at the 2:30 mark tells you your VSL is losing viewers at a specific story beat. That's surgical intel. A 1% conversion rate difference between two variants, at typical VSL traffic volumes, is mostly noise.
Use it as a leading indicator
If Variant B substantially improves 60-second retention, it is a strong candidate to outperform at scale, often before you've collected enough conversions to reach statistical significance. Watch depth lets you eliminate clearly losing variants early, before you've spent the budget to run them to conversion significance, then put your remaining runway behind the survivors.
The problem with "average watch time"
Aggregate metrics hide the real picture. A bimodal viewing pattern, where some viewers watch the full video and the majority exit at 45 seconds, can produce a perfectly acceptable average watch time. You'd never spot the hook problem. Second-by-second engagement heatmaps reveal the conversion signals hiding in your watch-depth data that averages flatten out entirely.
Revenue per viewer closes the loop
Watch depth becomes most powerful tied to revenue attribution. When you can see that viewers who reach the 70% mark convert at a rate that produces a specific revenue-per-viewer figure, you know the minimum engagement threshold required to produce a buyer. That number guides everything from script edits to bid strategy.
How to Set Up a VSL A/B Test Step by Step
Now that you know what to measure and when to trust it, here's how to structure the test itself.
Step 1: Write your hypothesis first. Before you touch the script or open your player, define what you're testing and what success looks like. Something like: "Changing the hook from a bold claim to a problem-first open will increase 30-second retention." Specific metric, specific threshold. No hypothesis, no test.
Step 2: Isolate exactly one variable. Record both variants with everything else held constant: same offer, same price point, same CTA wording, same video length within a narrow margin, avoid length differences large enough to change viewing behavior on their own. If your control runs 22 minutes, your challenger shouldn't run 18. Length variance alone will contaminate the result.
Step 3: Lock your thresholds before launch. Set significance at 95% minimum; consider 99% for decisions that will drive significant budget scaling. Then use a sample size calculator to set your minimum conversions per variant before you're allowed to read results. Write it down. This is the only thing that stops you from calling a winner on day three.
Step 4: Split traffic at the player level. Use your player's built-in A/B testing, not funnel-level redirects. Redirects can introduce page-load differences between variants; keeping both on the same page environment removes that variable. Traffic split should be 50/50 from the first session. VSLStats handles this natively; the setup process for creating a split test takes minutes and keeps both variants on the same page environment.
Step 5: Monitor watch-depth daily, hold conversion calls. Check your engagement heatmaps every day to spot obvious losers early. Do not call a conversion winner until you've hit both your minimum sample size and your significance threshold. Watching is fine; deciding early is not.
Step 6: Document everything, then move to the next test. Implement the winner, archive the loser with full notes on what you tested and what the data showed, then define the next single-variable test. Clean records mean your testing compounds instead of repeating itself.
VSLStats gives you the traffic split and second-by-second watch-depth signal in one player, so you're not stitching a host to a separate analytics tool and hoping the data syncs correctly.
Common Mistakes That Invalidate Your Results Mid-Test
Even a perfectly structured test can get corrupted after launch. Here are the mistakes that will void your results before you ever hit significance.
Changing your ad creative or targeting mid-test. The moment you shift your audience, you're comparing Variant A with Audience 1 against Variant B with Audience 2. Any result after that change is uninterpretable. Lock your targeting on day one and don't touch it.
Mixing cold and retargeting traffic. Retargeting audiences typically convert at a substantially higher rate than cold traffic. If both variants receive a different mix of warm and cold viewers, one variant will look like a winner purely because of audience composition. Segment them before launch, or run the test on cold traffic only.
Stopping during a promo spike or traffic surge. If you run a limited-time offer midway through, your conversion data for that window is not representative. That traffic behaved differently because of the external event, not your video. Discard the contaminated window or restart the test.
Calling a conversion win based on watch depth alone. Watch depth is a leading indicator; you still need conversion data to reach your pre-set threshold before you scale spend. If you're seeing gaps in reported data, it may be worth reading about how tracking gaps corrupt your baseline before you even begin testing.
Ignoring pixel data loss. Ad blockers and iOS privacy settings can suppress a meaningful share of conversion events, so your dashboard may undercount actual purchases. Server-side tracking closes most of that loss.
Running a new test after changing the funnel downstream. If you redesigned your checkout page or launched a new email sequence while a test is live, any conversion difference is partly attributable to those changes, not the video. Give funnel changes at least one full conversion cycle to stabilize before you start or resume a VSL test.
Run Tests That Actually Tell You Something
Avoid all those mistakes, and you're left with a test framework that actually holds up. Three requirements, every time: one variable per round, a significance threshold set before you launch (95% minimum), and watch depth as your primary signal rather than conversion rate alone.

If your traffic is limited, work in this order: test your hook first, then offer frame, then CTA. Don't skip ahead because one element feels more exciting to test.
This compounds. A clean hook test gives you a stronger baseline script. Your next test starts from a better position. Each rigorous test builds a tighter VSL, not a confused one built on noise.
You need traffic splitting at the player level, second-by-second engagement heatmaps to read watch depth accurately, and server-side conversion tracking so data loss doesn't quietly shrink your effective sample size. VSLStats puts all three in one place, built specifically for direct-response VSL funnels.
If your next traffic push doesn't include a properly structured split test, you're spending money to collect data you can't trust. Try any VSLStats plan for $1 at /pricing and run your first clean test on that traffic.
Conclusion
Most VSL split tests fail before they start, not because the marketer lacks data, but because the test was never designed to produce a clean answer.
Done consistently, clean testing turns every traffic push into a learning asset that compounds over time. Each properly structured test builds a stronger baseline for the next one.
Start your first properly structured test today. Try any VSLStats plan for $1 at /pricing.
Frequently asked questions
See what your VSL is really doing
Server-side pixels, AI captions, engagement heatmaps and revenue attribution - try any plan for $1.
Start your $1 trial