Average Watch Time Hides the Seconds That Matter on a VSL
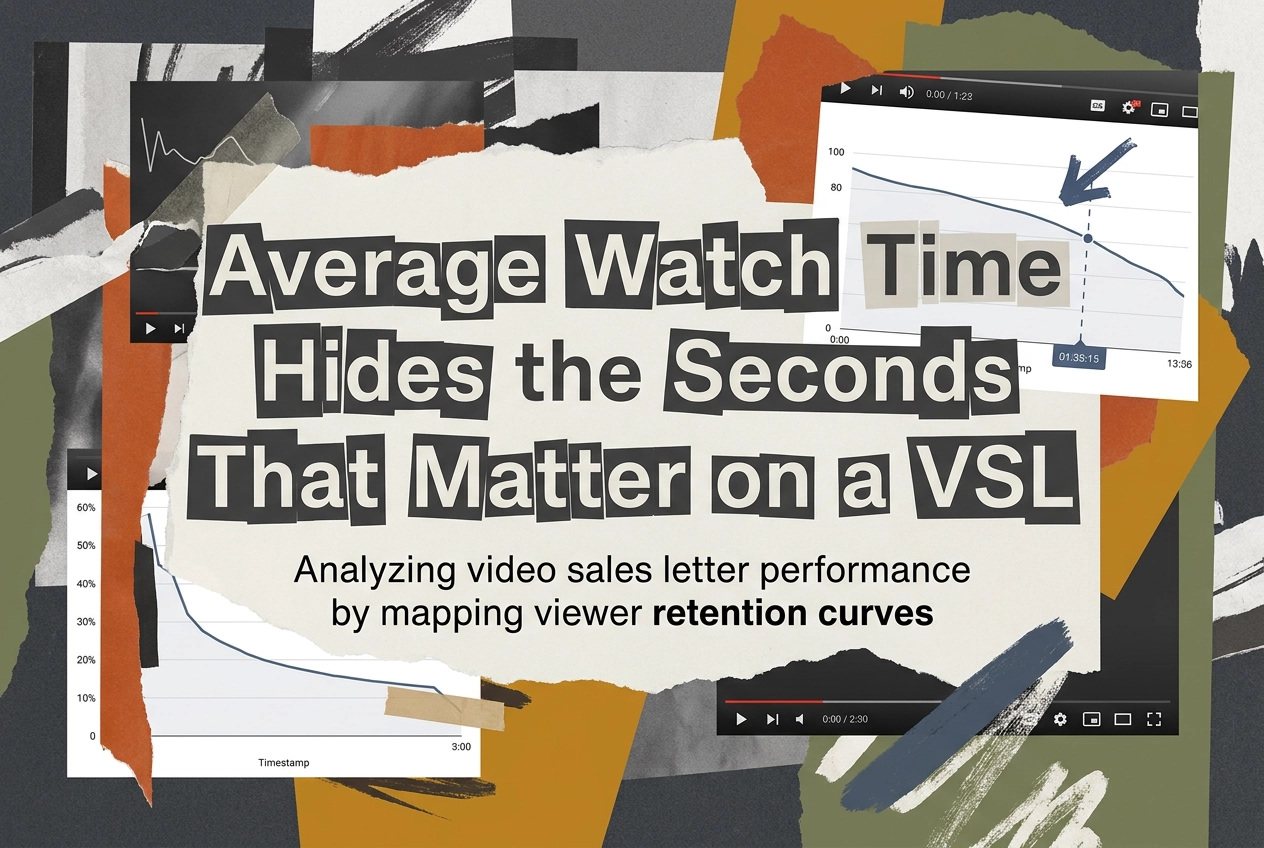
Your dashboard says your VSL holds viewers for an average of 2 minutes 47 seconds. That single number describes every viewer and tells you nothing about any one of them. It cannot tell you which line of your script lost the buyer at second 94, or why the drop started three sentences before your offer.
Averages compress a retention curve into a statistic you cannot act on. Plot the same data second by second and the picture changes: buyers leave at specific points, and those points map to specific lines, transitions, and claims. Your engagement heatmaps and script analysis stop being vanity charts and start being diagnostic instruments.
This tutorial treats the drop-off curve as the primary VSL metric. You will learn why average watch time fails as a diagnostic, what the curve actually shows, how to read retention on a sales video, and why the first 60 seconds carry disproportionate weight. From there, we separate exits from rewinds and spikes, map a dip onto the exact line that caused it, and cover how much data a dip needs before it means anything. You will also see where the average still earns its place, and how to turn the curve into your next script edit.
Why Average Watch Time Can't Tell You Which Line Lost the Buyer
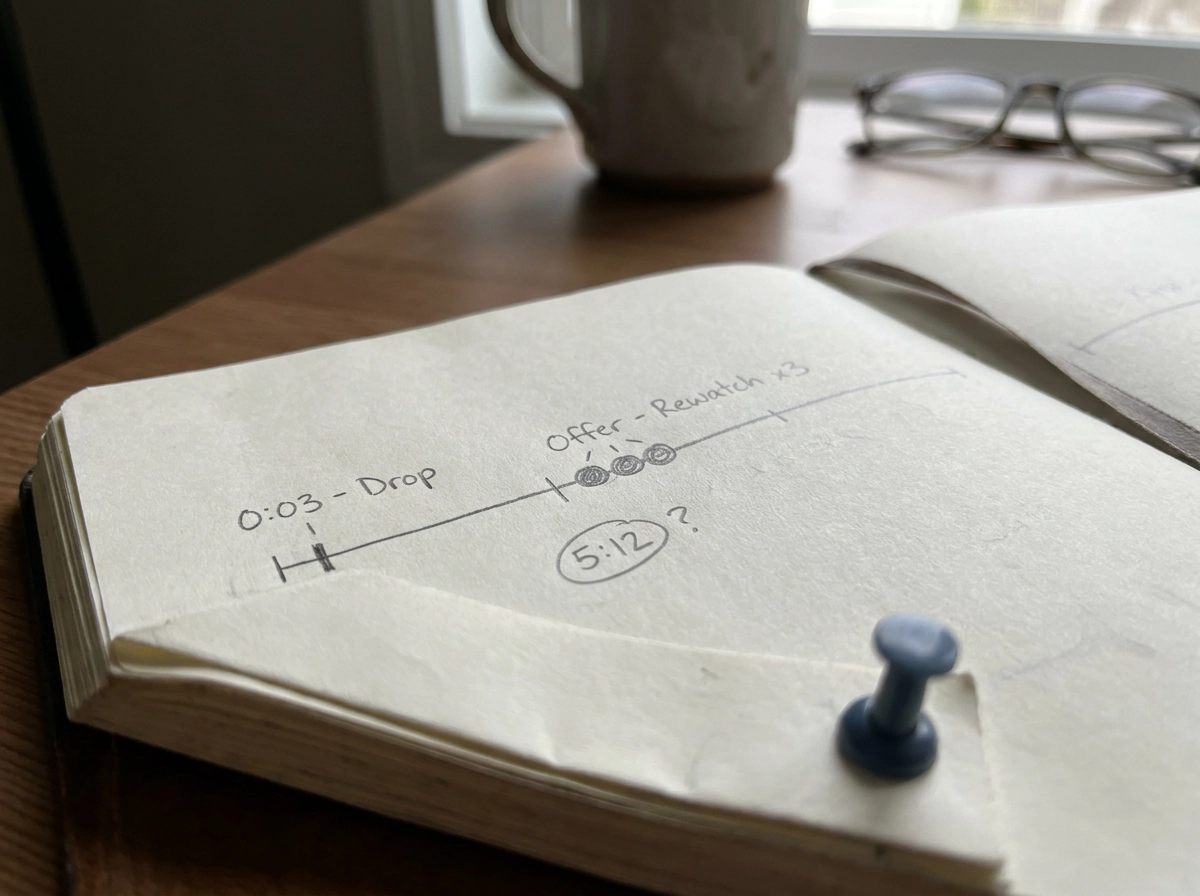
Average watch time is total watch time divided by total views. It's a ratio, not a location. A viewer who bails at 0:03 and a viewer who rewatches your offer three times both collapse into one number, and that number tells you nothing about which of those two behaviors you're paying for.
It also can't separate two videos with identical averages and completely different problems. In one, 200 viewers leave in the first 30 seconds and the rest watch to the end. In the other, 200 leave at the 12-minute mark. Same average. Two different script fixes.
That's the trap in treating average watch time as a benchmark: the average can hold steady while the curve underneath it moves. You can ship an edit that nudges the number up and still lose the viewers closest to buying, because the gain came from replays rather than new retention.
What you need on a sales video isn't how long people watched. It's where buying intent broke down. Intent lives at timestamps. A summary statistic has no timestamp.
Most teams default to the average because legacy video hosts put it front and center in the dashboard. That's a design choice from entertainment-era platforms, built for content discovery, not conversion, and it's not evidence the number answers a sales question. The curve does.

What the Drop-Off Curve Actually Shows
The average gave you a number without a location. The drop-off curve gives you the location. A retention curve plots the percentage of viewers still watching against time, second by second. You are not reading the overall slope. You are reading for cliffs: a steep drop at one timestamp is a discrete event, and you can trace it to the line playing at that second.
Four signals show up on a well-measured VSL curve. Exits mark where viewers leave. Rewinds and rewatches mark where they go back. Flat stretches mark where nothing disrupts attention. Recovery marks where retention holds after a drop.
Early drops carry more diagnostic weight than mid-video dips. A viewer leaving at 0:15 had almost no reason yet, so that loss points at the hook or the promise, not a pacing lull. Rewind clusters are the opposite signal. Viewers going back to re-hear a claim, a price, or a proof point are often your most engaged. That timestamp tells you what to repeat earlier.
A flat stretch after a cliff is qualified audience, not a problem. Everyone still watching cleared the same gate, so the content playing there is your control sample for what works.
The curve is a record of behavior, not a score to beat. Its only job is to send you to a timestamp with a specific question about the script beat playing there. Start with Step 1: Map Every Drop-Off to a Script Moment. That turns a shape on a chart into an edit you can make in the script.
How to Read a VSL Retention Curve
Now that you know what the curve shows, read it the same way every time. Normalize two ways before you interpret anything: percent of viewers retained, which works at any video length, and position in the video, the actual second. Normalise by percentage: the same four raw minutes means something very different at different video lengths.
Benchmark against your own previous script versions and against videos of similar length in your account, not a global average. For context on early script decisions, see What I'd do if I were launching a VSL next week, but your account history is the only fair baseline.
Read in a fixed order:
First 60 seconds.
The single largest drop.
Rewind clusters.
Final 90 seconds, where the close and call to action sit.
Watch for the cliff-then-plateau pattern. A steep drop followed by a long flat stretch usually means the viewers who stayed were qualified and you lost the rest to one specific beat. That narrows the edit to a single line.
Convert every read into a question about the script beat playing at that second, not a general verdict on the video. If the read doesn't point at a sentence, you haven't finished reading.
Keep an annotated curve for each script version. Confirm whether your last edit moved the timestamp you targeted, and by how much.
Start With the First 60 Seconds
Now apply that order. Assume the first 60 seconds is broken until the curve proves otherwise.
A drop in the opening is the most expensive kind. The viewer had no reason to leave yet, so the loss points at the promise itself, not at pacing twelve minutes in. On paid traffic, the opening is also where the ad's hook gets paid off. If the ad promised one thing and the video opens on another, you get a cliff immediately, and no mid-script rewrite recovers it.
Then locate the trigger. Does the drop start before or after your first specific claim or number? Before means the setup is too slow; after means the claim landed and got rejected. Those are different rewrites.
Recovering viewers here outranks a late-video fix, because every buyer who converts later passed through this gate first.
Separate Exits, Rewinds and Spikes
Past the opening, split three signals the dashboard merges into one:
An exit is a lost viewer. A rewind is a viewer asking for more detail. Opposite problems, opposite fixes.
Read rewind clusters by timestamp. Peaks in re-watching sessions indicate points of interest and confusion, so treat a cluster as a question, not a failure. A cluster of rewinds on one line is worth investigating, it may mean the claim landed but the wording didn't, or that the proof point needs to appear earlier. Treat it as a hypothesis to test, not a rule.
Read flat stretches as your control group. Whatever plays there is holding attention. Reuse that structure, that pacing, that proof format in weaker beats.
Segment by traffic source. A drop that appears on one campaign and not another is usually an ad-to-video message match problem, not a script problem. Rewriting the script would waste the edit.
How to Read Engagement Heatmaps is where you run all three reads.
Mapping a Drop to a Line in Your Script
The example below is illustrative. It shows the method, not a benchmark to expect in your own account. Read the structure, then run it on your own curve.
A 14-minute VSL on cold Meta traffic. The curve holds flat through the problem and story arc, then cliffs at the exact second the presenter pivots from the story into the offer stack. Those are fixed beats in the format, so What does a VSL script actually contain? makes the break easy to locate.
A cliff at a transition is a transition problem. The script leaves the story without a bridge, so viewers still invested in the narrative read the pivot as the start of the pitch and bail before the offer is stated.
The edit: carry the story's momentum through the turn with one bridge line that connects the problem in the story to the mechanism behind the offer. Then move the first price mention deeper into the stack.
Second signal: a rewind cluster further in, around the risk reversal. Don't fix it. Move a shorter version of the guarantee earlier, before the price, so fewer viewers hit the number without the safety net.
Then close the loop with revenue. Revenue attribution by viewer and watch depth shows whether the people who stayed past the cliff converted, which separates a cosmetic drop from a costly one before you spend the rewrite.
One caveat before you rewrite anything: the sample behind that timestamp has to be big enough to trust.
How Much Data Before a Dip Means Something
Before you rewrite that bridge line, ask whether the dip is real. There is no universal view count that makes a drop trustworthy. The threshold depends on your traffic volume, video length, and how many viewers actually reached that second.
Sample size shrinks as the video runs. A late timestamp might be reached by a few dozen people, so a percentage there can swing on a handful of exits while an early percentage barely moves. Read deep drops with more caution than early ones.
Judge a deep beat against the viewers who entered that section, not everyone who pressed play. Otherwise a strong line looks weak only because the funnel above it already bled attention.
Treat one week as noise. Before you rewrite, look for the same drop across two or three consecutive reporting periods, and confirm it holds on more than one traffic source. With enough volume, compare versions instead of weeks. A clean A/B split test with the same creative and the same audience tells you whether your edit moved the curve or the traffic did.
Clean data makes any of this worth trusting. VSLStats estimates that ad blockers and iOS privacy settings combined account for roughly 30% of browser-pixel conversion data loss, and that's one reason server-side pixel forwarding matters when you tie behavior to a specific timestamp. Sharper samples start with a heatmap that decodes viewer intent.
When a drop survives those checks, it has earned a rewrite.
Where Average Watch Time Still Earns Its Place
The average still earns a place, just not as the verdict. Treat it as a sanity check. If it moves sharply after a script edit while the curve looks unchanged, suspect traffic mix, ad creative or tracking before you credit the rewrite. The Metric Most Video Tools Get Wrong covers how summary-first dashboards mislead.
One number is also a fast filter. Glance at average watch time across your videos and you can spot a broken player, a misconfigured play gate or a campaign sending low-intent viewers without opening a single curve.
Respect the wobble. The average is total watch time divided by total views, so a few very short or very long views shift it without any real change in behavior. Never read it alone.
Split the jobs: rank with the average, diagnose with the curve. The average tells you which video deserves attention this week. The curve tells you which sentence to rewrite.
And neither replaces revenue. Revenue attribution closes the loop, covered in the Mapping section above.

Turn the Curve Into Your Next Script Edit
The average answers how long. The curve answers where and why, and where is the only one you can rewrite in a Google Doc this afternoon.
Make the loop a habit. After every script edit, pull the curve first, go straight to the timestamp you targeted, and note whether that drop moved. Run it version over version and the guesswork the average encourages starts to disappear.
Then pair the read with tooling that measures at the same resolution you edit at:
Engagement heatmaps show exits and rewinds at the second, so you see the timestamp, not a summary.
Script analysis connects the curve to your copy.
Revenue attribution confirms the edit reached buyers, not just viewers.
You can try any VSLStats plan for $1 and start reading your own drop-off curve the same day you plug in the player.
Conclusion
Diagnose with the drop-off curve: exits, rewinds and spikes read at the second, then tied back to specific beats in your copy. Fix the timestamp, not the whole script.
Try any plan for $1 at /pricing and start reading your own curve the day you plug in the player.
Frequently asked questions
See what your VSL is really doing
Server-side pixels, AI captions, engagement heatmaps and revenue attribution - try any plan for $1.
Start your $1 trial